
Marketing Mix Modeling, Explained Without Math (and Why 2 Years Isn't Enough)
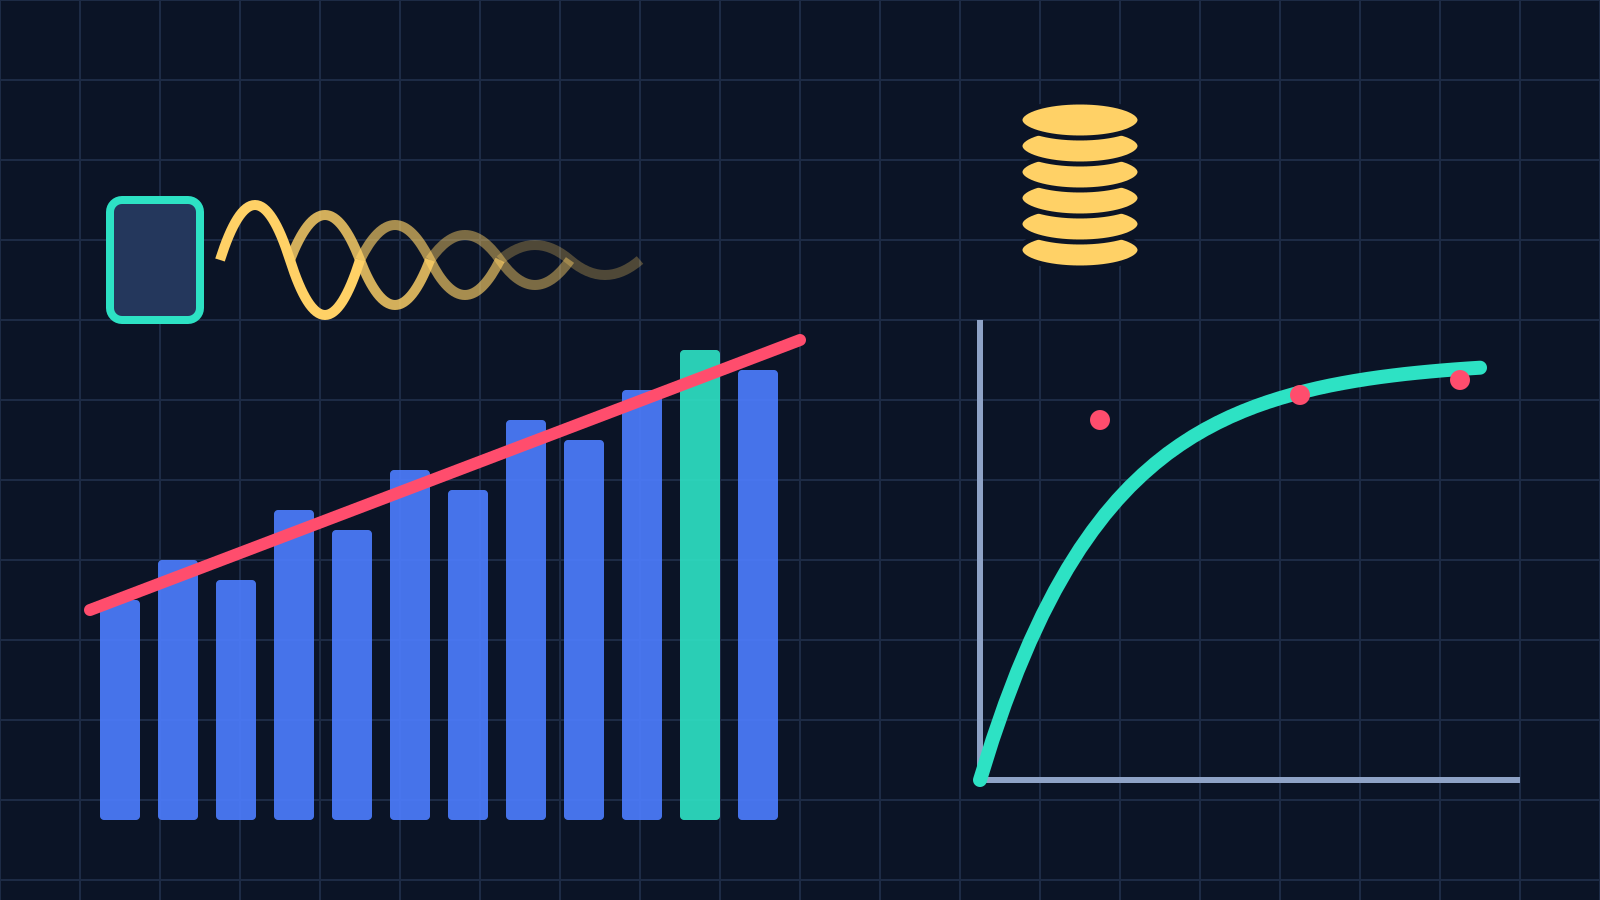
Marketing mix modeling (MMM) is a regression that estimates how much of your weekly sales each channel caused, using aggregate spend, sales, and outside factors like seasonality and pricing instead of user-level tracking. The catch is data: Google's own Meridian documentation says two years of weekly data across 12 channels leaves about 4 data points per parameter, which it calls too small. Aim for roughly 15.
That second sentence is the part most MMM explainers skip, and I think it's the most useful thing a non-statistician can know going in. The math behind MMM is genuinely not that scary. What trips teams up is asking a model to answer more questions than their data can support, then trusting the output because it came with a nice chart.
So this piece does two things. It explains how MMM actually works in plain language (three ideas, no equations), and it gives you a quick way to tell whether your business has enough data to bother. It deliberately skips the wider attribution-versus-experiments debate and zooms in on MMM itself.
Three ideas carry the whole model
Strip away the jargon and an MMM is doing one job: lining up weeks where you spent more on a channel against weeks where sales went up, and trying to separate that effect from everything else that moves sales. Holidays, price changes, a competitor's promo, the fact that December is December. That's the regression part. Sales on one side, spend and outside factors on the other, and the model figures out how much weight each one deserves.
Plain regression would get this wrong in two predictable ways, which is why every serious MMM adds two corrections.
Correction one: adstock (ads keep working after you stop paying). A TV flight or a YouTube push this week still nudges sales next week, and a bit less the week after. Adstock is the model's way of carrying a fraction of each week's spend forward and letting it decay. The paper introducing Meta's open-source Robyn package describes these settings as capturing "how marketing inputs decay over time and how they saturate." Fast decay suits search and retargeting. Slow decay suits brand and video.
Correction two: saturation (the tenth dollar works less than the first). Double your Meta budget and you almost never double Meta-driven sales. The model bends each channel's response into a curve that flattens as spend rises.
The easiest way I know to picture both: adstock is the echo, saturation is the sponge. Shout once and the sound hangs around for a bit. Pour water on a sponge and it soaks up the first cupful easily, then less and less until it's just dripping off the sides. Every channel in your model has its own echo length and its own sponge size, and the model's job is to estimate both from history.
The third idea is the one that makes MMM worth the effort: once you know each channel's curve, you can ask where the next dollar does the most work. Google's Meridian leans into this directly. When Google expanded Meridian in late 2025, it added marginal ROI priors specifically to help identify where the next dollar is likely to earn the most, along with support for non-media variables like pricing and promotions. Average ROI tells you what a channel did. Marginal ROI tells you what one more dollar would do, which is the question your budget meeting is actually asking.
Where the "for everyone" pitch falls apart
My honest read on the current moment: Meridian and Robyn are both free and open source (Robyn lives on GitHub), and there's a wave of vendors promising MMM for brands of any size. Free software is great. It doesn't make your dataset any bigger.
The Robyn paper says it plainly: an input dataset customarily contains at least two years of weekly observations of media spend and related variables, plus things like holidays and product launches. It also stresses that spending on each channel has to vary over time. If you've spent the same $4,000 a week on Google Search for 18 months straight, the model has nothing to learn from. No variation, no signal.
And two years is the floor, not the comfortable zone. Meridian's data guidance works through an example that, honestly, should be required reading for anyone buying an MMM tool:
- A national model with 12 media channels, 6 control variables, and 8 seasonality knots has 26 parameters to estimate.
- Two years of weekly data is 104 data points. That's about 4 points per parameter, and Google calls it too small.
- Narrow it to 3 channel groups, 2 knots, and 3 years of weekly data (156 points) and you get about 15 points per parameter.
Read that again if you run a DTC brand with a dozen line items in your media plan.
The fix Google suggests is mostly subtraction: combine channels, drop the low-spend ones, simplify. Which is a slightly awkward message for anyone hoping MMM would tell them how their 12 channels compare. In most cases I've seen discussed, the realistic first model compares 3 to 5 buckets (paid social, paid search, video, everything else), and that's still useful.
Geo data changes the math a lot, for what it's worth. The same Google page shows 105 regions across 3 years of weekly data producing 16,380 data points. If your sales are trackable by state or DMA, that's probably the single biggest upgrade you can make to an MMM before buying anything.
A guide from Cometly on MMM for small businesses puts the size problem more bluntly: traditional MMM was built for Fortune 500 companies with massive budgets and years of clean data. I'd soften that a bit now that the tools are free. But the data requirement didn't get the memo about the tools getting cheaper.
The 15-minute data check before you build anything
Before you spin up Meridian, book a vendor demo, or ask an analyst to "just run an MMM," do this in a spreadsheet:
- Count your weeks. Pull weekly revenue (or leads) going back as far as your data is consistent. Under 104 weeks, stop here and read the next section instead.
- Count your parameters. One per channel you want measured, one per control variable (promos, price changes, major launches), plus a few for seasonality. Be honest about how many channels you actually want separated.
- Divide. Weeks divided by parameters. Under 10, merge channels until you clear it. Around 15, you're in the range Google's own example treats as workable.
- Check variation. For each channel, look at weekly spend over the period. If a channel's spend barely moved, or it was always on at the same level, fold it into another bucket. The model can't estimate an effect it never saw change.
- Check the lights-off weeks. Did you ever pause a channel, or double it? Those weeks are gold. If you've never touched a channel's budget, you probably don't have enough information to measure it yet.
If you clear all five, MMM is likely worth a real attempt. If you fail two or more, I'd personally spend the next quarter creating variation on purpose (more on that below) rather than modeling noise.
This connects to something we covered in our GA4 settings guide: measurement fails quietly. Nobody gets an error message when their model has too few points per parameter. You just get confident-looking ROI numbers that would flip if you added two more weeks of data.
Calibrate with experiments or treat the output as a guess
This is the part I'd underline for anyone evaluating MMM vendors. A model fit to historical data finds correlations. It can easily credit a channel for sales that would've happened anyway, especially if you always spend more during your busiest season. The Robyn authors say outright that using randomized experiments to calibrate observational models is the key mitigation for this, because causal inference from observational data alone can regularly produce misleading results.
Calibration means feeding the model results from real lift tests (geo holdouts, conversion lift studies) so it can't wander too far from what an experiment actually measured. Recast's guide to calibration makes two points worth stealing:
- Only calibrate with experiments that line up exactly with what you're modeling. Not another brand's test, not an industry benchmark.
- Fit statistics like R-squared or in-sample MAPE cannot tell you whether an MMM is correct. A model can fit history beautifully and still be wrong about causality.
That second one surprised me the first time I read it, because "the model explains 94% of the variance" is exactly the slide every MMM pitch opens with. It's a fit score. It says nothing about whether the model got cause and effect right.
Google is clearly pushing in this direction too. In September 2026 it moved Meridian GeoX to general availability, an open-source tool for geo experiments whose incrementality results can be fed back into an MMM as another source of evidence. The same update let Meridian incorporate brand signals like Branded Google Query Volume. You can read the GeoX documentation if you want the setup details.
The fair caveat: Google building both the model and the experiment tool, plus feeding it Google's own search data, is a lot of Google in your measurement stack. I don't think that's disqualifying. I'd just want at least one test that runs on a non-Google channel, the same skepticism we applied when Meta said its GEM model lifted conversions 18.9%. Compared to what, measured by whom.
Benchmark for this section: one geo or conversion lift test per quarter on your biggest channel is a reasonable starting cadence. Recast's guidance suggests experiment influence should fade as results age, so a single test from 2024 isn't really calibrating anything anymore.
If you're under the data floor, do this instead
Most small and mid-sized brands reading this will fail the 15-minute check, at least on the first pass. That's fine. The useful move isn't skipping MMM forever. It's setting yourself up to pass in a year.
Start creating spend variation deliberately. Pick one channel per quarter and either pause it for three to four weeks in a set of regions or push it up 50% somewhere. Log every change with dates in a shared sheet. Those deliberate swings do double duty: they're lift tests you can read on their own today, and they're exactly the variation a future MMM needs to separate channel effects.
And start logging your control variables now. Promo dates, price changes, stockouts, PR spikes, that one week the site was down. This is the data almost nobody keeps, and it is usually the first thing an analyst asks for when the model gets built.
My prediction, with stakes: by the end of 2027, more than half of brands that adopt a free MMM tool without experiments to calibrate it will have a model that recommends shifting budget toward whatever channel ramped up during their peak season. It's the most common way an uncalibrated model fools itself, and the free tools make it very easy to get there fast.
FAQ
How much data do you need for marketing mix modeling?
The Robyn paper treats at least two years of weekly data as customary. Google's Meridian guidance goes further, showing that two years across 12 channels is too thin and aiming for roughly 15 data points per parameter. Geo-level data helps a lot.
Is MMM better than multi-touch attribution?
They answer different questions. Attribution follows individual user paths and struggles with privacy gaps and offline channels. MMM uses aggregate data, so it handles TV and brand spend, but it needs more history and experiments to stay honest.
Can I run MMM without a data scientist?
You can install and run the open-source tools yourself. But someone needs to choose the channel groupings, sanity-check the curves, and design calibration tests. I wouldn't skip that person for a first model.
None of this makes MMM less worth doing. It mostly means the hard part comes before the model runs, not after, and the brands that start logging and testing now will probably have the more honest answer when they get there.
By Notice Me Senpai Editorial