The 102 'Richest' US ZIP Codes Hold Just 0.7% of (K+ Households
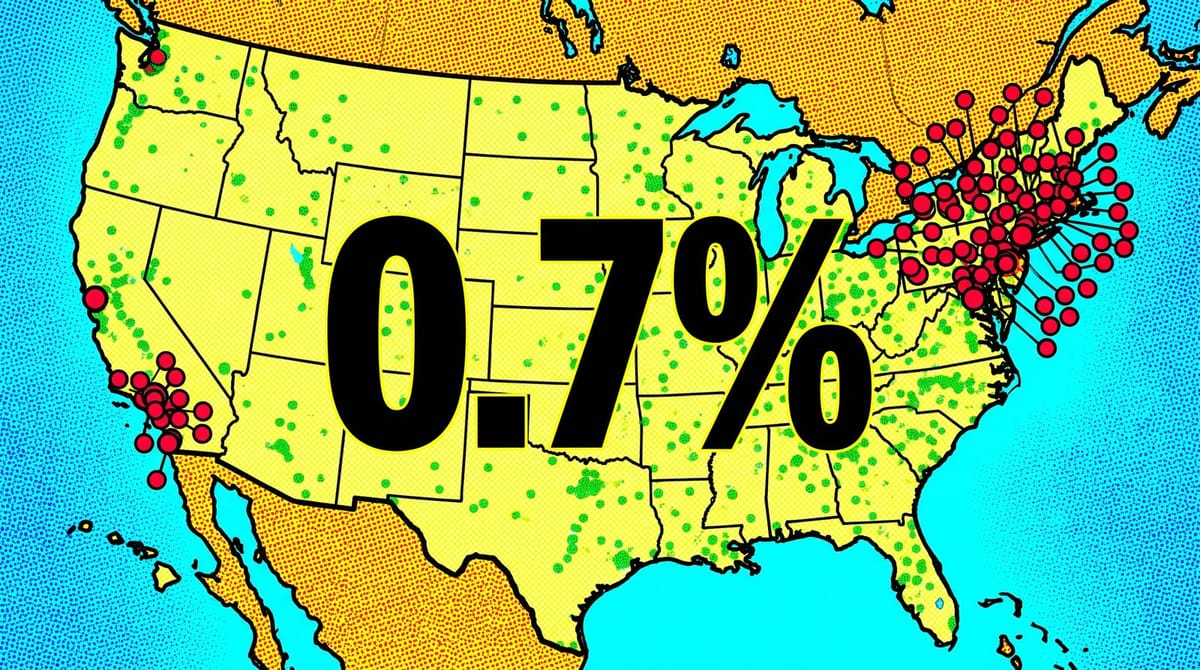
The 102 "richest" US ZIP codes by median income contain just 0.7% of all American households earning $150,000 or more, according to a post that ran in r/PPC this week, citing US Census American Community Survey data. The remaining 99.3% of $150K+ households live across thousands of other ZIPs, including ordinary suburbs, exurbs, and small towns. Marketers stacking premium bid adjustments on the top-100 "affluent ZIPs" overlay are paying CPM premiums to reach less than one percent of their actual high-income target.
Where the math actually goes wrong
The mistake is using ZIP-level median income as a proxy for the density of $150K+ households. They are not the same metric. A ZIP can have a $250K median because it has 1,500 households, all clustered between $200K and $400K. A neighboring ZIP can have a $90K median across 12,000 households, but if even 8% of those clear $150K, that single "ordinary" ZIP holds more affluent households than the famous one.
Windfall, a wealth data provider, ran the same exercise from a different angle and found a similar gap. In their sampling, when advertisers buy the "top 5%" income ZIPs, 57.3% of households inside those ZIPs earn under $200K, and 29.5% earn under $100K. So you are paying a premium to reach a population where roughly three in ten households would not even clear the median income for a top-25 metro.
The Atherton, Short Hills, and Fairfax Station ZIPs that headline every "richest in America" listicle (Atherton's median home price is around $7.75M per CNBC's most-expensive-ZIP report) are statistically real, but the households inside them are a sliver. The complete Wikipedia list of highest-income ZIP code tabulation areas covers roughly 250 ZCTAs above $200K median. Even that wider cut still leaves the overwhelming majority of $150K+ households outside the boundary.
Why agencies still default to the top-ZIP overlay
Convenience and prestige. The "top 100 wealthiest ZIPs" CSV has been passed around media plans since 2009. It looks decisive in a slide. Account managers like that they can name the ZIPs (Greenwich, Bel Air, Hinsdale) when a CMO asks who they are reaching. And ZIP-level overlays were one of the first geo-targeting tactics in Google Ads and Meta, so they survive in templates long after the underlying assumption stopped holding.
Affluence is also less geographically locked than it was 15 years ago. Remote work, smaller secondary cities, and the post-2020 housing reshuffle put a meaningful share of $150K+ earners in places that have never made any "richest ZIP" listicle. From what I have seen across paid accounts, a flat top-ZIP overlay tends to underperform the same campaign without the overlay on conversion rate, because the bid premium pulls budget away from the rest of the country where most of the buyers actually live.
What the bid math looks like in practice
If you put a +30% bid adjustment on a 102-ZIP list that holds 0.7% of your target audience, you are doing two things at once. You are inflating CPCs in a tiny pocket where competition from luxury brands is already brutal, and you are starving the 99.3% of buyers outside that pocket of impression share. The first effect is visible in your auction insights. The second is not, which is why the practice has hung on for so long.
One way to see it is to pull the geographic performance report and compare conversion-value-per-impression in your overlay ZIPs against the rest of the campaign. In most accounts, the overlay ZIPs will index higher on CTR and lower on conversion rate. That gap is what you are paying for.
It also does something subtler to your Smart Bidding learning. If your bid model is being told that ZIP X is +30% more valuable, the algorithm trusts that input and routes spend accordingly, even when the conversion data inside ZIP X disagrees. The bid adjustment overrides what the auction would have learned on its own. That is a fight you tend to lose slowly, over weeks of slightly worse ROAS, rather than as a single visible drop.
The 30-minute swap that hits the other 99.3%
Google Ads has a household income tier built into demographic targeting. The "Top 10%" bracket is defined as households earning above $146,001, which lines up almost exactly with the $150K+ ACS bracket the original Reddit post is referencing. It works in Search, Display, Demand Gen, and Video campaigns.
It does not work in Performance Max or standard Shopping, per Search Engine Land's recent demographics deep-dive. That is the catch. PMax controls a growing share of paid spend and will not let you exclude or bid up specific income brackets. The closest workaround is feeding PMax a customer match list weighted toward HHI signal you already have in your CRM, and letting the algorithm find lookalikes from there. It is messier than a bid adjustment but it does not collapse to "the same 102 ZIPs everyone else is bidding on."
Meta has its own version, sourced from IRS aggregated AGI data segmented by ZIP averages. It is still ZIP-derived, so it inherits some of the same weakness, but at least it covers the top 25% bracket nationally rather than locking you to a hand-picked CSV of 102 places. Worth using over a custom ZIP overlay in most cases.
Where this all falls apart
Three caveats worth keeping in mind. First, Google's HHI is modeled, not verified. The platform infers income from device, behavior, and location signals, and the precision is fuzzier than the marketing copy suggests. Second, the "Unknown" income bucket can swallow 25 to 40% of impressions depending on how much signal Google has on the user, and excluding Unknown by default cuts a lot of your reach for almost no quality lift. Third, the HHI tier rewards conversion-value optimization more than it rewards bid stacking. If your conversion signal is already broken, layering HHI on top will not fix it (we covered the underlying signal problem in our earlier piece on smart bidding optimizing for the wrong conversions).
And honestly, none of this is news to senior media buyers. The frustration in the original r/PPC thread was less about the stat itself and more about the fact that this same overlay keeps showing up in fresh agency proposals in 2026. The data point gives the industry a clean number to reference when pushing back.
Audit your account before Friday
Pull every campaign in your Google Ads account that has a ZIP-list targeting overlay or a ZIP-list bid adjustment. Count the ZIPs. If the list looks like the standard 100-to-200 "wealthiest" file, run the geographic performance report for the last 90 days and check conversion value per impression for those ZIPs against the rest of the country. If the gap is not at least 1.5x, the overlay is not earning its premium.
Then, where the campaign type allows, swap the ZIP overlay for an HHI Top 10% or Top 10-20% bid adjustment instead. For PMax, accept that you cannot bid on HHI directly and instead push the income signal into your customer match list and conversion-value reporting. That is the structural fix.
The 102 ZIPs are not the prize. They are the most visible 0.7% of the prize, and the bid premium attached to them is what every other advertiser is also paying. Most of the affluent households you actually want to reach are sitting in places nobody is fighting over.
Notice Me Senpai Editorial