Google Won't Backfill 50 Weeks of Bad Search Console Data
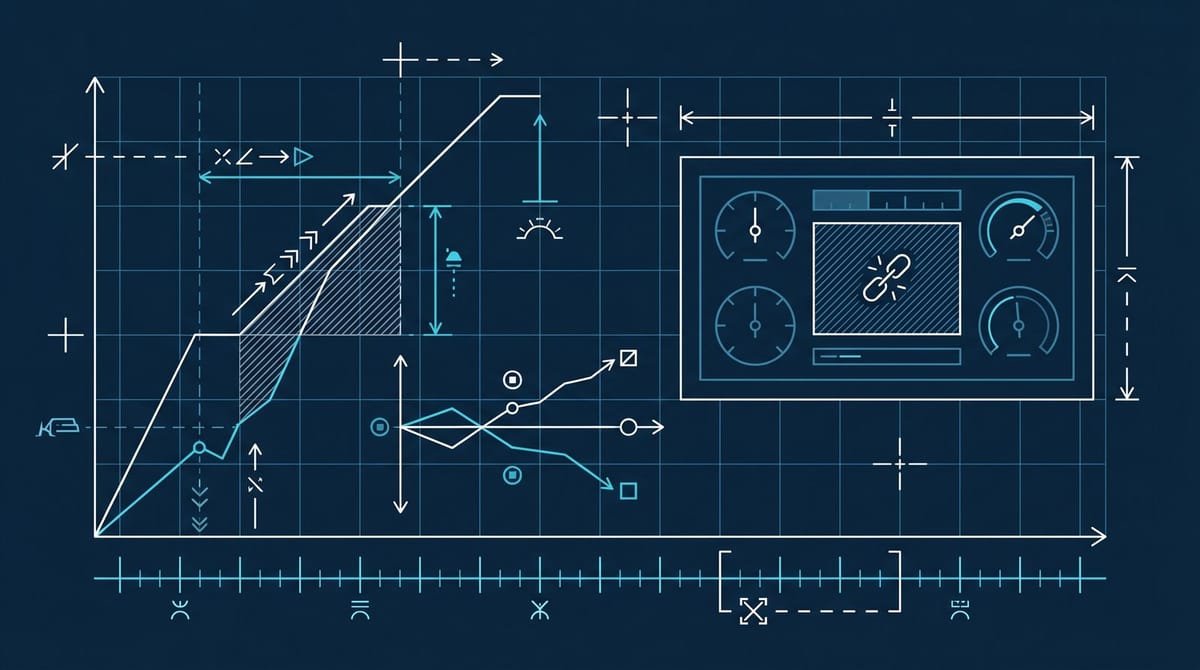
Google fixed a Search Console logging error that overstated impressions from May 13, 2025 to April 27, 2026. The fix only restores accuracy going forward. The 50 weeks of inflated historical data will stay in place permanently. That means anyone reporting year-over-year impressions through July 2026 is comparing real numbers to a fiction Google has refused to backfill.
The fix is forward-only, and Google said so quietly
Search Engine Land flagged it cleanly. Google updated its Data Anomalies in Search Console page on April 3, 2026 to acknowledge the bug, and the rollout finished around April 27. Clicks were never affected. Average position and CTR were, because both depend on impressions in the denominator.
The thing Google won't say in the doc, but says anyway through what isn't there: the fix is one-way. From John Mueller's responses on Bluesky and the wording on the data anomalies page, the historical numbers stay as logged. SEL spelled it out with the headline "well, kind of." That reads about right.
Most teams haven't internalized what that means yet. If your YoY dashboard pulls Search Console impressions for any week between May 2025 and April 2026, the comparison line is junk. Not "directionally interesting" junk. Actually unusable.
The Passionfruit numbers are uglier than Google admitted
Google never said how inflated the data was. A Passionfruit Labs analysis filled in some of the gaps. Across 17 properties spanning B2B SaaS, ecommerce, media, and professional services, with annual impressions ranging from 2.52 million to 292 million, they found a conservative estimate of 30 to 50% impression inflation on most properties.
The aggregate: 656 million reported impressions against 9.5 million clicks across the cohort. Blended CTR of 1.4%. They estimate 150 to 220 million phantom impressions in there.
The most extreme case in the dataset, Property N, had 36.3 million impressions logged against 62,000 clicks. That works out to a 0.2% CTR, which the analysts described as "almost entirely artificial." Property L showed impressions spiking to roughly 180,000 daily through July and August 2025, then collapsing in September when Google removed the &num=100 parameter, which is the closest thing the public has to a confirmed mechanism for at least part of the inflation.
I think the &num=100 angle matters more than people are giving it credit for. Most of the early speculation about this bug pointed at scrapers (rank trackers, AI training crawlers, and SERP feature monitors) that pulled the first 100 results in one request and inflated impression counts across positions 11 through 100. Google never confirmed the mechanism. The Property L pattern fits that theory almost too neatly. If you ran a deep-position content strategy through 2025 because the impressions story looked promising at depth, that read may have been a measurement artifact rather than a real signal worth chasing.
Where this actually breaks marketing reporting
Three places.
First, anyone whose SEO program is benchmarked on impressions and average position is going to look like they're losing this summer. They're not. Their benchmark is. If you don't reset that internally before the deck goes to leadership in July, you're going to spend a quarter explaining a "decline" that's just the noise being removed.
Second, content teams using Search Console as the input for "what's working" lost a year of signal. If you cut a topic cluster in October because it had a soft CTR profile, the inflation may have made every CTR look softer than it actually was. From what I've seen in GSC data, the inflation isn't evenly distributed across queries either, so you can't just apply a flat 30% deflator to clean it up.
Third, Google's quiet deindexing of pages AI Overviews already cannibalized is now stacked on top of this. Pages that lost their click but kept their impression in the inflated era look one way. The same pages, post-fix, look catastrophically worse, even if AI Overview behavior didn't change. Untangling those two stories at the page level is going to take work.
A working approach for the next quarter
What you can actually do in the next 15 minutes.
Annotate the affected window in any reporting tool that supports it. Looker Studio, Tableau, internal dashboards, the Google Sheets export your CMO looks at. Mark May 13, 2025 through April 27, 2026 as "data quality affected." Anyone reading the report should see it inline, not buried in a footnote.
Pull two snapshots in parallel, pre-fix and post-fix, for any campaign you'll need to defend in a Q3 review. The rough deflator approach: take the post-fix April 28 to May 4 weekly impression baseline and assume historical equivalents were inflated by 30 to 50%. It's not precise. It's defensible.
For YoY work, switch to clicks where you can. Clicks weren't affected. Average position will be wrong. Position-weighted impressions will be wrong. Click counts and click-through patterns at the URL level are the cleanest surviving signal until April 2027, when the tail of the broken window finally rolls off the 12-month view.
And honestly, this is one of those moments where the integrity of the analytics conversation matters more than the dashboard itself. Google sat on this for nearly a year. The Data Anomalies page went up quietly on April 3. There was no email to property owners. If someone on your team only learned about this from an industry newsletter, well, that's the bar Google has set for proactive communication on data integrity, and it's not a high one.
The reporting line you actually need to hold
Most of the work this summer is going to be about not letting bad numbers become bad decisions. The teams I've seen handle this kind of thing well usually stop trying to "save" the broken data and start writing transparent notes about what isn't trustworthy. Skip the impulse to invent a normalization formula. The honest answer is "we don't know" for that window. Saying so publicly, in writing, on the dashboard, is the move.
Whether Google ever owns the size of this in print is its own question. From what I've seen, they probably won't. The data anomalies page will likely read about the same in six months. You're the one holding the meeting.
Notice Me Senpai Editorial