Lunio Audited 2.7B Clicks. TikTok Was 24% Fake, Google Was 7.57%.
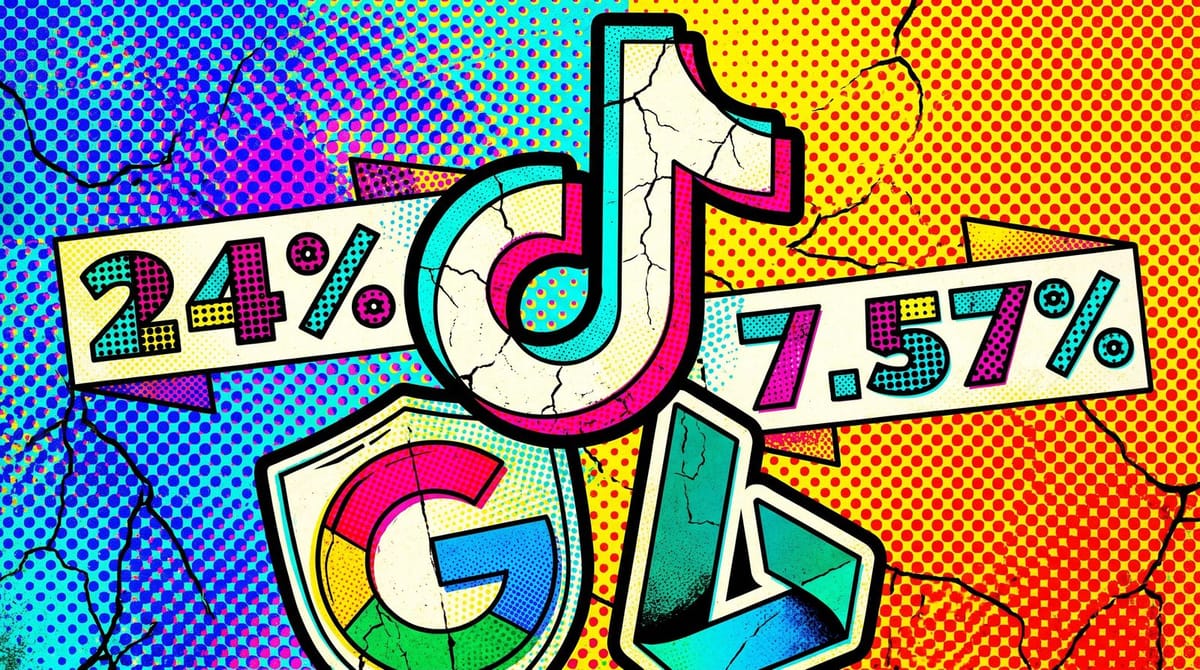
Lunio's 2026 Global Invalid Traffic Report analyzed 2.7 billion paid ad clicks across six major networks and reported TikTok at 24.20% invalid traffic, LinkedIn at 19.88%, X at 12.79%, Bing at 10.32%, Meta at 8.20%, and Google at 7.57%. The 17-point spread between the highest and lowest is wider than any single network has ever publicly disclosed about itself. Anything materially above your network's published rate is the lever for a refund or a make-good claim, assuming you bring documentation.
The platform gap is wider than any network admits in earnings
Networks self-report invalid traffic in fragments. Google publishes broad invalid-click thresholds in its Ads Help Center, Meta cites the MRC for verification, and TikTok mostly points to its trust and safety reports. None of those publications put the six platforms on the same axis with the same methodology. Lunio's report did, and the cross-platform numbers are uncomfortable for anyone who runs a multi-channel paid budget by treating "secondary" platforms as cheaper-but-similar.
What the data actually shows: TikTok's invalid traffic is roughly three times Google's. LinkedIn's is more than two and a half times. Bing, which most B2B teams run as a low-effort Google complement, is about 36% worse than Google on the same metric. The waste in absolute dollars lands hardest on LinkedIn because the CPCs are the highest, but the rate that should change procurement behavior is Bing's. Most teams I have seen treat Bing's lower volume as proof of cleaner inventory. From what is in this dataset, that assumption is wrong.
Where the 7.57% Google number falls apart
The 7.57% headline applies to Google as a whole. The campaign-type breakdown from Lunio's Google-only analysis is where the negotiation actually starts:
- Google Video Partners: 20.62%
- Display: 12.02%
- Shopping: 8.46%
- Demand Gen: 8.45%
- Performance Max: 7.88%
- Search: 5.21%
The takeaway is that "Google" the platform is not the unit you should be benchmarking against. Search is doing roughly 5%, Performance Max is around 8%, and the partner inventory drags the platform-wide average up. If your Search-only spend is closer to 8% than 5%, you have a question to ask. If your Performance Max spend looks closer to Display at 12%, the asset network or partner inventory is probably the culprit, and you can ask Google for an itemized breakdown.
The early AI Max number is worth flagging too. Lunio's report cites a luxury retailer whose invalid traffic rose from 3.7% to roughly 5 to 6% after AI Max for Search was enabled, attributed to broader query matching. That is a 35% jump on the same account. We covered the related disclosure issue where Google's AI label is itself underspecified, and this looks like the same pattern. The new feature scales reach, the inventory it scales into hasn't been audited at the same level Search has, and the IVT delta is the early warning.
Bing is the trap most secondary buys walk into
Bing's 10.32% IVT lands closer to LinkedIn than to Google. That number runs against years of agency conventional wisdom that Bing is "just cleaner" because of its smaller share. Microsoft Q&A threads are full of advertisers describing Search Partners traffic depleting budgets without a single convertible click, and a few of those threads include account-level breakdowns showing partner placements with single-digit conversion rates and abnormally high CTRs.
If you are running Bing, the practical move is to turn off Search Partners on every campaign, then re-evaluate. The Microsoft Audience Network is a separate problem, with similar complaints on the same Q&A board and weaker exclusion controls than Google's. From what I have seen, the cleanest baseline is treating Bing search-only as your benchmark and treating anything else from that account as needing to prove its case. We also wrote about Microsoft Ads' new conversion-by-publisher disclosure, which gives Bing accounts more leverage than they had a quarter ago.
What the Pixalate data adds
Pixalate's Q1 2026 North America benchmarks measure something different. The dataset is 82 billion programmatic impressions, broken down by device, with US numbers at 24% IVT for desktop and mobile web, 32% for mobile apps, and 24% for connected TV.
That is a programmatic open-auction figure, not a Google or Meta figure, and it is worth holding next to the Lunio platform numbers as a sanity check. When CTV-buying CMOs hear that 24% of their North American programmatic CTV impressions are invalid, the comparison they should be making isn't to Google's 7.57%; it is to their own DSP's pre-bid filtering. If the DSP is reporting 4% IVT and Pixalate is reporting 24% on the same inventory pool, somebody's filter is reading optimistically.
What to bring to your account rep this month
The point of having one normalized cross-platform IVT number is that it gives every paid lead a script for the next quarterly business review. The script is roughly:
- Your platform's published IVT rate, in writing.
- Your account's invalid click rate over the last 90 days, exported from the platform.
- The gap, if any, between your account and the published rate.
- A request for either a refund, a make-good in impressions, or a documented investigation.
The strongest version of this conversation is on Bing and Performance Max. Bing because the published "we monitor and refund" claim is hard to hold the company to without external numbers, and now there is a 10.32% benchmark to anchor the conversation. PMax because the campaign-type number gives you a way to challenge attribution into asset and partner placements that Google has historically declined to itemize. A 7.88% PMax IVT on a $3M annual spend is around $236,000 of waste before you account for the placement mix; that is a number worth a meeting.
The thing nobody on a vendor call will say
Click fraud detection has always been graded on a curve. Networks publish their IVT rates the same way restaurants publish health inspection scores: voluntarily, for the audience that already trusts them. Lunio's report is the closest thing the industry has to a third-party score for paid traffic right now, and the numbers it produced rank platforms in roughly the order most performance marketers privately do.
What changes this quarter is that it is possible to walk into a TikTok or LinkedIn budget review with a single number ("24.20%", "19.88%") that came from outside the platform's own measurement stack. That is a different conversation than the one most teams have been having. Mostly because it isn't a conversation about whether fraud exists. It's a conversation about how much of it the platform is comfortable charging for, and whether your contract still works at that rate.
I am skeptical the 24% TikTok number stays at 24% for long once advertisers start pushing on it. Numbers like that have a way of moving once they become inconvenient. The opportunity is the next two quarters, where this is still a useful negotiation anchor, before the platforms that don't want to talk about it figure out what to say.
Notice Me Senpai Editorial